Prices surge ever higher with £5million being asked for Dickens Yard penthouse
|

There are increasing concerns about both overheating and affordability in the local property market with new figures showing that local prices have moved even higher in the second half of this year from levels that were already at an all-time high.
The average price of a home in West Ealing (W13) rose to £665,313 in the third quarter of this year up by 7.5% over the last year according to figures from the Land Registry. This now exceeds the average for the W5 post code area but this is because flats make up a higher proportion of the housing stock in the central area of Ealing. If you compare the average house or the average flat between the two areas it is more expensive in W5.
W5 prices actually fell compared with the same period last year but this appears to be mainly because of the increased proportion of flats being sold. In the shorter term prices have also fallen but it is believed that this is due to more expensive units within central Ealing developments such as Dickens Yard having been sold earlier with cheaper units now making up the bulk of transactions. There is, however, still an opportunity to buy the penthouse in Vista Apartments in Dickens Yard. Developer St. George’s are hoping someone will pay £5,000,000 for it.
Factors such as Crossrail have increased the premium for properties in Ealing leading to prices going way beyond the reach of a large proportion of people even if you don’t wish to own a penthouse.
There was also demand for family houses in the area with a property on Gordon Road changing hands for £2,438,000. This is the fourth highest price paid for a home in the area.
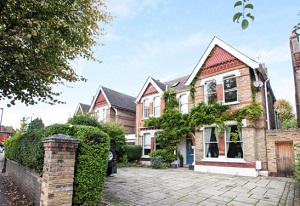
Gordon Road
Estate agents in Ealing say they are seeing an influx of househunters from Chiswick and even further afield areas such as Clapham seeking to jump on the Crossrail 'bandwagon'.
The advent of the new rail link - scheduled to be complete in 2019 is encouraging more investors to seek property close to the stations, particularly in Hanwell, West Ealing and Ealing Broadway.
Ray Upcraft, of Russell Collins estate agents says, ''Ealing house prices continue to rise and in some cases W13 'outbids' W5 because of the imminent arrival of Crossrail. There has been a noticeable influx of people from the likes of Chiswick/Clapham in particular purely jumping on the Crossrail bandwagon and the feeling in the industry is there will be a further increase as we get closer to its introduction.
''Given that W5/W13 are already better served by public transport than Chiswick, especially, this should come as no surprise.''

The September figures from the Land Registry’s Market Trend Data survey show that London remains the country’s best performing area in terms of residential property price rises. The average price in the capital is now just short of half a million at £499,997 up by 9.6% over the last year. The average property value in England and Wales rose by 5.3%to £186,553. Monthly house prices up 1.0 per cent since August 2015.
The number of completed house sales in England and Wales decreased by 4% to 81,696 compared with 84,691 in July 2014. The number of properties sold in England and Wales for over £1 million in July 2015 decreased by 9% to 1,413 from 1,555 a year earlier. Repossessions in England and Wales decreased by 50 per cent to 471 compared with 943 in July 2014 with only 36 taking place in London during the month.
In October, 25% more chartered surveyors in London saw house prices rise according to the latest RICS UK Residential Market Survey, compared to a balance of 26% more in September, showing a steady increase month-on-month.
However, only 5% more chartered surveyors are expecting a rise in prices in the capital over the next three months – this is the lowest reading across the UK over this time period. Despite this, the twelve month view for the capital is still relatively strong with 53% more respondents expecting prices to increase.
Demand from potential buyers grew modestly across London in October with 7% more respondents seeing a rise in new buyer enquiries. Demand continues to considerably outpace supply and the number of new instructions decreased for the ninth month in succession, with 9% more chartered surveyors reporting a fall, contributing to the rise in prices in the capital. The supply of new listings to the UK market as a whole has been in decline since the start of the 2015 with a decrease in new instructions in London every month this year.
In the London lettings market, demand increased at broadly similar pace to that of supply in the three months to October, as new landlord instructions rose at the quickest quarterly pace since early 2014. Nevertheless, rental expectations remain strong and respondents continue to expect rents to rise over the year ahead. Rental growth in the London is anticipated to accelerate to an average of around 4.5% per year over the coming five years.
Simon Rubinsohn, RICS Chief Economist, commented, “It is hard to get away from the issue of supply when it comes to the current state of the housing market. The legacy of the drop in new build following the onset of the global financial crisis is now really hitting home with both the sales and letting markets continuing to show demand outstripping supply on a month by month basis. And if the five year projections from members regarding the outlook for both prices and rents is anything to go by, property is set to become even more unaffordable going forward making the governments focus of boosting to delivery of new homes absolutely critical.”
Changes to the tax regime have also had an impact in the top end of the market with the turnover of larger family houses in the area falling.
Adrian Gill, director of Reeds Rains and Your Move estate agents, said, “The Chancellor’s intimidating Stamp Duty remodel is still spooking the top end of the London market. Properties worth over £1.5 million have been hit with a stamp duty increase, currently set at 12% of the portion of the property’s value above £1.5m, up from 5% previously. As a result, sales of homes worth more than £1.5 million have fallen by 35% in Q3, compared to a year ago. This tax has really put the shackles on the prime market in the capital, as three quarters of these sales since January 2014 took place in London. “
In a forthcoming edition of the Ealing Today newsletter there will be a complete listing of recent property sales in the area. To register to receive it click here.
| Ealing W5 Post Code Area Property Prices - (July - September 2015) | ||||||||||
|---|---|---|---|---|---|---|---|---|---|---|
Area |
Detached |
Sales |
Semi-detached |
Sales |
Terraced |
Sales |
Flat/ |
Sales |
Overall Ave |
Overall Sales |
| W5 1 | 1650000 | 1 | 901000 | 5 | 799800 | 10 | 419177 | 11 | 694961 | 27 |
| W5 2 | 2369000 | 2 | 1125017 | 3 | 634975 | 2 | 562953 | 60 | 644182 | 67 |
| W5 3 | 1200000 | 2 | 1210000 | 4 | 775000 | 1 | 410035 | 23 | 581527 | 30 |
| W5 4 | 1375000 | 2 | 817590 | 5 | 739267 | 15 | 368057 | 16 | 626733 | 38 |
| W5 5 | 1150000 | 1 | 1120000 | 4 | 886143 | 7 | 542357 | 12 | 764220 | 24 |
| Total | 1586000 | 8 | 1013714 | 21 | 780999 | 35 | 493575 | 122 | 653371 | 186 |
| Change in Quarter | -6.4% | 60.0% | 19.0% | 162.5% | 1.2% | 20.7% | -5.9% | 10.9% | 4.1% | 22.4% |
| Change in year | 1.4% | -52.9% | -5.3% | -16.0% | 10.4% | -20.5% | 10.2% | 8.0% | -3.8% | -6.5% |
| Change in three years | 6.2% | -20.0% | 38.7% | 16.7% | 41.3% | -28.6% | 58.9% | 87.7% | 23.1% | 31.0% |
| Change in five years | 19.2% | 14.3% | 61.6% | 0.0% | 54.5% | -10.3% | 74.6% | 67.1% | 45.6% | 32.9% |
| Ealing W13 Post Code Area Property Prices - (July-September 2015) | ||||||||||
|---|---|---|---|---|---|---|---|---|---|---|
Area |
Detached |
Sales |
Semi-detached |
Sales |
Terraced |
Sales |
Flat/ |
Sales |
Overall Ave |
Overall Sales |
| W13 0 | 0 | 0 | 624238 | 8 | 757156 | 8 | 414853 | 19 | 540953 | 35 |
| W13 8 | 1812500 | 2 | 1161000 | 8 | 814000 | 5 | 451969 | 16 | 781113 | 31 |
| W13 9 | 1550000 | 1 | 955833 | 6 | 761121 | 35 | 404400 | 20 | 677617 | 62 |
| Total | 1725000 | 3 | 909859 | 22 | 765969 | 48 | 421849 | 55 | 665313 | 128 |
| Change in Quarter | 35.3% | 50.0% | -0.6% | 22.2% | 4.4% | 108.7% | 3.1% | 41.0% | 5.2% | 56.1% |
| Change in Year | 27.1% | -70.0% | 8.3% | 83.3% | 6.8% | 65.5% | 9.6% | 0.0% | 7.5% | 20.8% |
| Change in Three Years | 55.5% | -25.0% | 32.3% | -4.3% | 58.9% | -2.0% | 54.3% | 17.0% | 44.3% | 4.1% |
| Change in Five Years | - | - | 57.9% | 0.0% | 54.7% | 11.6% | 70.6% | 31.0% | 60.5% | 19.6% |
Data in this report is subject to crown copyright protection.
November 12, 2015