W5 post code sales now averaging over half a million pounds
|
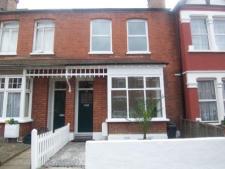
Houses in central Ealing are selling at record levels with average prices now hitting the half a million pounds mark for the first time.
According to latest figures from the Land Registry (April - June 2102) the average price of a home in the W5 post code area was £521,554.
This was partly driven by increased activity at the top end of the market. Eight detached homes exchanged hands in W5 at an average of £1.7million. That's a 33% increase in the year. The Woodville Gardens property which sold for £2,600,000 in April is helping drive the market at the top end but even without this average house prices would have been over £500,000.
This quarter - a traditionally busy one for estate agents - also saw a brisk market for terraced house sales. 42 changed hands in W5 at the highest ever average for this type of property.
In W13 sales have remained steady with 16 semis, 27 terraced and 43 flats changing hands. Prices for terraces have seen a 9.1% increase in the year again averaging at just over half a million pounds.
Peter Ttouli, Sales Manager at haart Estate Agents says , ''Activity levels in Ealing are proving to be rather boisterous. Properties are selling quickly provided the agency involved, ensures that prospective buyers are financially qualified prior to conducting appointments.
'' The outlook for the rest of the summer looks to be extremely promising''
For England and Wales as a whole the House Price Index shows an annual price increase of 0.9% which takes the average property value in England and Wales to £161,777.
In a forthcoming edition of the Ealingtoday.co.uk newsletter there will be a complete listing of recent property sales in the area.
To register to receive it click here.
Ealing Property Prices - April - June 2012
W5 Post Code Area
| Area | Detached | Sales | Semi-Det | Sales | Terraced | Sales | Flat/ Mais |
Sales | Total Ave | Total Sales |
|---|---|---|---|---|---|---|---|---|---|---|
| W5 1 | 0 | 0 | 580750 | 4 | 629585 | 10 | 306750 | 8 | 503311 | 22 |
| W5 2 | 1719500 | 4 | 0 | 0 | 0 | 0 | 341072 | 20 | 570810 | 24 |
| W5 3 | 1521250 | 4 | 655625 | 4 | 818333 | 3 | 266880 | 13 | 609664 | 24 |
| W5 4 | 0 | 0 | 675000 | 3 | 419250 | 22 | 281577 | 11 | 398496 | 36 |
| W5 5 | 0 | 0 | 815625 | 4 | 704285 | 7 | 337399 | 5 | 617468 | 16 |
| Total | 1620375 | 8 | 682200 | 15 | 545342 | 42 | 307530 | 57 | 521554 | 122 |
| Change in Quarter | 26.9% | 100.0% | 9.2% | -6.3% | 16.4% | 16.7% | 11.0% | 0.0% | 23.4% | 8.0% |
| Change in year | 33.0% | -11.1% | -13.4% | 15.4% | 15.1% | 55.6% | 1.3% | 1.8% | 7.4% | 16.2% |
| Change in three years | - |
- |
16.7% | -37.5% | 15.7% | 133.3% | 21.0% | 32.6% | 32.5% | 43.5% |
| Change in five years | 40.9% | -38.5% | 29.7% | -42.3% | 16.1% | -35.4% | 6.4% | -52.1% | 24.3% | -45.3% |
W13 Post Code Area
| Area | Semi-Det | Sales | Terraced | Sales | Flat/ Mais |
Sales | Total Averages | Total Sales |
|---|---|---|---|---|---|---|---|---|
| W13 0 | 482500 | 4 | 432700 | 3 | 260618 | 16 | 321652 | 23 |
| W13 8 | 770500 | 4 | 0 | 0 | 277299 | 10 | 418214 | 14 |
| W13 9 | 468062 | 8 | 509102 | 24 | 292205 | 17 | 427152 | 49 |
| Total | 547281 | 16 | 500613 | 27 | 276985 | 43 | 397481 | 86 |
| Change in Quarter | -19.3% | 23.1% | 9.5% | -6.9% | 1.9% | 16.2% | -2.3% | 8.9% |
| Change in Year | 0.8% | 128.6% | 9.1% | -18.2% | 19.8% | 87.0% | 3.2% | 36.5% |
| Change in Three Years | 27.1% | 45.5% | 41.0% | -18.2% | 32.6% | 152.9% | 21.2% | 41.0% |
| Change in Five Years | -2.9% | 33.3% | 11.3% | -18.2% | -2.0% | -65.9% | 18.8% | -49.7% |
Data in this report is subject to crown copyright protection.
August 9, 2012