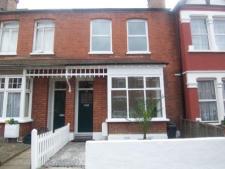
'West Ealing premium' doesn't reflect reality
|
Ealing's property prices have fallen according to the latest official numbers but higher sales volumes are likely to provide some comfort to estate agents and vendors in the area.
Once again the average price in W13 has exceeded that of W5 but a closer analysis suggest it would be misleading to claim that there is a West Ealing premium. The average price in the fourth quarter of 2011 in W5 according to the Land Registry was £419,578 compared to £447,631 in W13. However, the average does seem distorted by a higher proportion of detatched and semi-detatched properties selling in W13. The average terraced house and the average flat sells for a premium in W5.
Prices are down in both areas by about 8% compared with the previous quarter but generally the number of sales is up. Compared with three years ago transaction volumes have more than doubled.
This surge in sales may be partly due to the exemption on Stamp Duty for first time buyers on purchases sales below £250,000 which expires next month.
The December data from Land Registry's flagship House Price Index shows an annual price decrease of 1.3% which takes the average property value in England and Wales to £160,384.
The only region in England and Wales to experience an increase in its average property value over the last 12 months is London with a movement of 2.8% to £345,298. The North East experienced the greatest annual price fall with a decrease of 7.1% and the most significant monthly price fall with a decrease of 1.9%.
The most up-to-date figures available show that, during October 2011, the number of completed house sales in England and Wales decreased by 6% to 55,309 compared to 58,634 in October 2010. The number of properties sold in England and Wales for over £1 million in October 2011 decreased by 10% to 525 from 582 in October 2010.
In a forthcoming edition of the Ealingtoday.co.uk newsletter there will be a complete listing of recent property sales in the area.
To register to receive it click here.
Ealing Property Prices - October - December 2011
W5 Post Code Area
| Area | Detached | Sales | Semi-Det | Sales | Terrace | Sales | Flat/ Mais |
Sales | Total Ave | Total Sales |
|---|---|---|---|---|---|---|---|---|---|---|
| W5 1 | 0 | 0 | 573000 | 5 | 531500 | 10 | 272550 | 9 | 443040 | 24 |
| W5 2 | 944250 | 4 | 0 | 0 | 593333 | 3 | 319086 | 22 | 433686 | 29 |
| W5 3 | 0 | 0 | 730306 | 8 | 455116 | 6 | 299550 | 25 | 411843 | 39 |
| W5 4 | 0 | 0 | 493250 | 6 | 485264 | 24 | 272532 | 29 | 381513 | 59 |
| W5 5 | 0 | 0 | 729333 | 9 | 0 | 0 | 298330 | 10 | 502489 | 19 |
| Total | 944250 | 4 | 651105 | 28 | 499350 | 43 | 293140 | 95 | 419578 | 170 |
| Change in Quarter | -51.1% | 33.3% | -4.1% | -3.4% | 1.6% | -20.4% | 3.8% | 30.1% | -8.1% | 6.9% |
| Change in year | -6.9% | -33.3% | 4.2% | 55.6% | 1.7% | 26.5% | -2.8% | 66.7% | -5.8% | 47.8% |
| Change in three years | 102.3% | 33.3% | 14.9% | 86.7% | 19.7% | 104.8% | 9.8% | 163.9% | 11.3% | 126.7% |
W13 Post Code Area
| Area | Detached | Sales | Semi-Det | Sales | Terrace | Sales | Flat/Mais | Sales | Total Ave | Total Sales |
|---|---|---|---|---|---|---|---|---|---|---|
| W13 0 | 0 | 0 | 448749 | 4 | 404750 | 8 | 240431 | 8 | 347822 | 20 |
| W13 8 | 1315000 | 3 | 824437 | 8 | 0 | 0 | 265230 | 10 | 628228 | 21 |
| W13 9 | 0 | 0 | 633772 | 11 | 434244 | 33 | 268573 | 19 | 419118 | 63 |
| Total | 1315000 | 3 | 667912 | 23 | 428489 | 41 | 261585 | 37 | 447631 | 104 |
| Change in Quarter | -11.6% | -40.0% | 6.2% | 4.5% | -8.4% | 0.0% | 2.8% | 19.4% | -8.3% | 5.1% |
| Change in Year | - | - | 36.1% | 21.1% | -12.1% | 20.6% | 5.5% | -9.8% | 16.7% | 10.6% |
| Change in Three Years | - | - | 58.8% | 228.6% | 18.8% | 86.4% | 40.8% | 105.6% | 47.9% | 121.3% |
Data in this report is subject to crown copyright protection.
March 21, 2012
