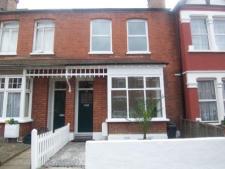
W5 and W13 areas seeing a huge surge in sales
The latest Land Registry figures show more property is changing hands for higher prices in the Ealing area.
|
In W5 prices were down slightly in the latest quarter but well up (more than 11%) year on year. Flats sales have also shown a good recovery more recently.
In W13 the average price of a property was up by a massive 40% to £424,528 with increased activity in the detached and semi-detached market.
Terraced houses and flat sales are also up 20% year on year. The volumes are double compared with the same time last year.
In December, London experienced an annual house price change of 6.1 per cent according to the Land Registry. This is the third month in a row that prices have increased year on year. Although London’s annual movement has mirrored that of England and Wales for some time, it now appears that London’s growth in general is increasing more rapidly.
The figures for England and Wales as a whole in December show an annual increase of 2.5 per cent. This brings the average house price in England and Wales to £161,783. This is the first positive annual house price change since May 2008.
Right Move's House Price index, which is based on offered prices rather than sales prices, is showing that in January in London prices rose to an average of £407,731. This represents an annual change of 5.5% Right Move say their figures show 'century low' stock levels for estate agents with the average agent having less than 65 properties on their books.
Miles Shipside, commercial director of Rightmove said, “the decision of post New Year sellers to ask for a higher price could be a shrewd move. In spite of problems brewing for later in the year, there are definitely some of the ingredients for a buoyant spring, and a window of opportunity that sellers may wish to take advantage of ”.
The numbers below are subject to revision as is it usual that some properties are added late to the Land Registry's database.
Ealing Property Prices - October - December 2009
W5 Post Code Area
| Area | Detached | Sales | Semi-Det | Sales | Terrace | Sales | Flat/ Mais |
Sales | Total Ave |
Total Sales |
|---|---|---|---|---|---|---|---|---|---|---|
| W5 1 | 0 | 0 | 475642 | 7 | 446489 | 13 | 293109 | 11 | 398647 | 31 |
| W5 2 | 1205000 | 5 | 0 | 0 | 0 | 0 | 293642 | 20 | 475914 | 25 |
| W5 3 | 1090166 | 3 | 845000 | 4 | 0 | 0 | 275014 | 21 | 443778 | 28 |
| W5 4 | 0 | 0 | 431062 | 8 | 441520 | 22 | 248187 | 8 | 398617 | 38 |
| W5 5 | 0 | 0 | 0 | 0 | 535000 | 3 | 264166 | 6 | 354444 | 9 |
| Total | 1161937 | 8 | 534631 | 19 | 450600 | 38 | 279437 | 66 | 419993 | 131 |
| Change in Quarter | - | - | -7.9% | -38.7% | -1.1% | 0.0% | 10.7% | 13.8% | -5.8% | -1.5% |
| Change in year | 149.0% | 166.7% | -5.7% | 26.7% | 8.0% | 81.0% | 4.6% | 83.3% | 11.4% | 74.7% |
| Change in three years | - | - | - | - | - | - | - | - | 8.4% | - |
W13 Post Code Area
| Area | Detached | Sales | Semi-Det | Sales | Terrace | Sales | Flat/ Mais |
Sales | Total Ave |
Total Sales |
|---|---|---|---|---|---|---|---|---|---|---|
| W13 0 | 0 | 0 | 472500 | 4 | 399495 | 10 | 196365 | 13 | 312507 | 27 |
| W13 8 | 1142000 | 3 | 829357 | 7 | 526658 | 6 | 265850 | 7 | 619669 | 23 |
| W13 9 | 0 | 0 | 490243 | 8 | 429766 | 27 | 230817 | 11 | 392709 | 46 |
| Total | 1142000 | 3 | 611444 | 19 | 436246 | 43 | 224280 | 31 | 424528 | 96 |
| Change in Quarter | - | - | 3.6% | -5.0% | 4.7% | 19.4% | -4.9% | 0.0% | 8.3% | 10.3% |
| Change in Year | - | - | 45.3% | 171.4% | 21.0% | 95.5% | 20.8% | 72.2% | 40.3% | 104.3% |
| Change in Three Years | - | - | - | - | - | - | - | - | 30.7% | - |
Data in this report is subject to crown copyright protection.
February 9, 2010
