Clusters of Covid Infections in Greenford and West Ealing
Borough remains one of the worst affected areas in London
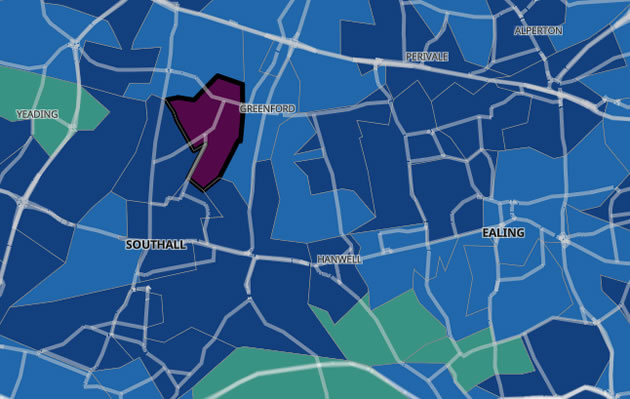
The darker the marked area the higher the rate of infection. Picture: ONS
|
The latest detailed information on Covid-19 cases in Ealing borough shows that currently there is a hot spot in the Greenford area.
The Office of National Statistics (ONS) publishes the number of cases at a very local level. The borough of Ealing is divided into Middle Layer Super Output areas (MSOA) by the ONS.
The area designated as Greenford Ravenor Park MSOA had an infection rate of over 400 per 100,000 population one of the highest rates in London. There were 30 cases in the area, an 87.5% rise over the previous week.
Earlier on this month the area designated as Drayton Green & Cleveland in West Ealing had the highest infection rate in London. We asked Ealing Council if they could provide an explanation for the cluster of infections in the area but they did not respond. Although the number of cases has declined there were still 34 new cases reported over the last week.
The areas with the lowest levels of infection are South Ealing and Elthorne Park which have both seen fewer than 100 cases per 100,000 population over the last week.
| Ealing Covid-19 Infections To 6 November | |||
|---|---|---|---|
| Area | Cases | Weekly rate per 100,000 | Change (%) |
| Whitton Avenue West (MSOA Ealing 001) | 10 | 106.8 | 0.0 |
| Horsenden (MSOA Ealing 002) | 20 | 228.1 | 100.0 |
| Northolt West (MSOA Ealing 003) | 22 | 219.1 | 37.5 |
| Northolt East (MSOA Ealing 004) | 14 | 208.6 | 75.0 |
| Bilton Road (MSOA Ealing 005) | 13 | 190.5 | 44.4 |
| Greenford North (MSOA Ealing 006) | 15 | 178.3 | 25.0 |
| Perivale (MSOA Ealing 007) | 17 | 226.1 | 0.0 |
| Northolt South (MSOA Ealing 008) | 24 | 288.8 | 20.0 |
| Kingshill Avenue (MSOA Ealing 009) | 16 | 187.2 | 77.8 |
| Greenford West (MSOA Ealing 010) | 16 | 152.1 | -5.9 |
| Hanger Hill East (MSOA Ealing 011) | 28 | 361.9 | 55.6 |
| Greenford South (MSOA Ealing 012) | 13 | 175.2 | -18.7 |
| Pitshanger (MSOA Ealing 013) | 16 | 257.0 | 166.7 |
| Greenford Ravenor Park (MSOA Ealing 014) | 30 | 407.8 | 87.5 |
| Cuckoo Park (MSOA Ealing 016) | 21 | 226.9 | -8.7 |
| Southall North (MSOA Ealing 017) | 31 | 369.7 | 24.0 |
| Drayton Green & Cleveland (MSOA Ealing 018) | 34 | 372.3 | 17.2 |
| Ealing Broadway West (MSOA Ealing 019) | 21 | 236.4 | -4.5 |
| Ealing Broadway East (MSOA Ealing 020) | 26 | 177.8 | -7.1 |
| Brent Valley (MSOA Ealing 022) | 7 | 117.0 | -41.7 |
| Southall Park (MSOA Ealing 023) | 29 | 307.8 | 16.0 |
| Southall West (MSOA Ealing 026) | 24 | 199.2 | -4.9 |
Ealing Common & Twyford Ave (MSOA Ealing 027) |
10 |
118.3 |
-42.1 |
| West Ealing (MSOA Ealing 028) | 14 | 132,3 | 0.0 |
| Norwood Green North & Windmill Park (MSOA Ealing 029) |
38 | 329.7 | 90.0 |
| Hanwell (MSOA Ealing 030) | 21 | 290.8 | 250.0 |
| St Mary's (MSOA Ealing 031) | 15 | 168.3 | -28.6 |
| Northfields (MSOA Ealing 032) | 12 | 153.3 | -33.3 |
| Elthorne Park (MSOA Ealing 035) | 5 | 77.7 | -37.5 |
| Southall Green (MSOA Ealing 037) | 38 | 267.8 | -7.3 |
| Norwood Green South (MSOA Ealing 038) 14 confirmed deaths |
18 | 211.1 | 23.1 |
| South Ealing (MSOA Ealing 039) | 5 | 77.3 | -68.7 |
Contains MSOA names © Open Parliament copyright and database right 2020
Contains Ordnance Survey data © Crown copyright and database right 2020
Contains Royal Mail data © Royal Mail copyright and database right 2020
Contains Public Health England data © Crown copyright and database right 2020
Office for National Statistics licensed under the Open Government Licence v.3.0
Although Ealing no longer has the highest rate of infection of any borough in London it remains one of the worst affected with 214 cases per 100,000 in the week to 6 November.
Ealing Council leader Julian Bell said when announcing the new government lockdown restrictions, "In Ealing we have had one of the highest rates of Covid in the capital over recent weeks and the scientists are saying that rates are to increase further. We must act now to protect our community. By doing so we can save lives.”
November 12, 2020