First time buyer drought as local market turnover falls even further
|
There has been no let up in the dire market conditions for property in the Ealing area. While prices remain reasonably stable, turnover has plummeted further from the already historically low levels seen so far this year.
With Brexit uncertainty, rising interest rates and the traditionally quiet summer months ahead, there is no immediate prospect of a recovery.
Land Registry figures for the latest quarter (April to June) show just 65 properties being sold in W5 and even fewer in West Ealing (W13) with only 33 homes changing hands. Estate agents already hard pressed by rising business rates will be continuing to struggle with such low levels of commissions on offer.
The collapse in demand has hit the flat sector hardest with volumes falling by a half from the already depressed level in the first three months of the year. The buyer's strike for new build units continues with only one being sold during the period although it may be that it is too early for any sales in the Filmworks development in central Ealing to have been recorded.
Estate agents say that turnover is notoriously slow at this time of year but there is concern as to why the lower end of the market isn't shifting.
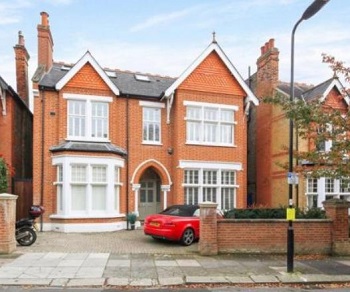
7 bedroom house on Kings Avenue sold for £3million
Ray Upcraft of local independent agent Russell Collins said, "We have found that the market between £800,000-£1.2million is much healthier than the lower end of £400-500,000. This is the first time for many years it’s been the case but the reason is Ealing has good schools, attracting buyers from Shepherd’s Bush, Chiswick, Kensal Rise etc. The lower end suffers from (next to) no buy to let buyers and relies heavily on the 'Bank of Mum and Dad.'"
Prices on average in W5 are up by 12.9% over the last year but this is entirely down to the sale of more expensive houses declining more slowly that those for flats. Demand still exists for good quality family homes at the top end of the market with a 7 bedroom house on Kings Avenue going for £3million.

The latest House Price Index data published by the Land Registry shows that London prices are the only ones that have fallen over the last year (to May) with the average now £478,853.
Figures for July from the Nationwide House Price Index show that the average price of a home in the UK rose by 2.5% to £217,010.
The was before the Bank of England’s Monetary Policy Committee (MPC) will increased rates at their next meeting at the beginning of the month from 0.5% to 0.75%. There is not a high degree of concern that the rise in interest rates will have much impact on the property market. Commenting on the figures, Robert Gardner, Nationwide's Chief Economist, said, “Providing the economy does not weaken further, the impact of a further small rise in interest rates on UK households is likely to be modest.
“This is partly because only a relatively small proportion of borrowers will be directly impacted by the change. Most lending on personal loans and credit cards is fixed or tends to be unaffected by movements in the Bank Rate. Similarly, in recent years, the vast majority of new mortgages have been extended on fixed interest rates.”
| Ealing W5 Post Code Area Property Prices - (April to June 2018) | ||||||||||
|---|---|---|---|---|---|---|---|---|---|---|
Area |
Detached |
Sales |
Semi-detached |
Sales |
Terraced |
Sales |
Flat/ |
Sales |
Overall Ave |
Overall Sales |
| W5 1 | 0 | 0 | 1022500 | 1 | 665700 | 5 | 391183 | 6 | 558175 | 12 |
| W5 2 | 2950000 | 2 | 0 | 0 | 1025000 | 3 | 710900 | 5 | 1252950 | 10 |
| W5 3 | 1470000 | 5 | 1006650 | 3 | 0 | 0 | 490583 | 9 | 869718 | 17 |
| W5 4 | 0 | 0 | 831250 | 4 | 757857 | 7 | 478286 | 7 | 665444 | 18 |
| W5 5 | 0 | 0 | 1270000 | 2 | 893333 | 3 | 441667 | 3 | 818125 | 8 |
| Total | 1892857 | 7 | 990745 | 10 | 799361 | 18 | 499662 | 30 | 808243 | 65 |
| Change in Quarter | 36.5% | 0.0% | 12.4% | -37.5% | -7.3% | -33.3% | -15.4% | -53.8% | 8.7% | -43.5% |
| Change in year | 7.4% | 75.0% | -15.5% | -9.1% | -6.9% | -33.3% | 1.1% | -49.2% | 12.9% | -35.6% |
| Change in three years | 44.1% | -41.7% | -9.8% | -9.1% | 2.7% | -43.8% | -5.9% | -71.2% | 19.0% | -59.1% |
| Change in five years | 21.3% | -41.7% | 27.8% | -58.3% | 33.4% | -50.0% | 12.7% | -71.4% | 35.7% | -63.3% |
| Change in ten years | - | - | 41.0% | 11.1% | 62.1% | -41.9% | 75.6% | -49.2% | 108.4% | -34.3% |
| Ealing W13 Post Code Area Property Prices - (April to June 2018) | ||||||||||
|---|---|---|---|---|---|---|---|---|---|---|
Area |
Detached |
Sales |
Semi-detached |
Sales |
Terraced |
Sales |
Flat/ |
Sales |
Overall Ave |
Overall Sales |
| W13 0 | 0 | 0 | 706500 | 4 | 810000 | 1 | 344123 | 7 | 503739 | 12 |
| W13 8 | 1365000 | 1 | 1031750 | 4 | 0 | 0 | 345000 | 1 | 972833 | 6 |
| W13 9 | 0 | 0 | 760000 | 3 | 804444 | 9 | 195500 | 3 | 673767 | 15 |
| Total | 1365000 | 1 | 839364 | 11 | 805000 | 10 | 303669 | 11 | 666314 | 33 |
| Change in Quarter | -27.8% | -50.0% | -20.5% | 0.0% | 13.5% | -58.3% | -23.9% | -65.6% | 1.8% | -52.2% |
| Change in year | 39.6% | -50.0% | -10.0% | -45.0% | -4.6% | -58.3% | -32.5% | -45.0% | -11.8% | -50.0% |
| Change in Three Years | 7.1% | -50.0% | -8.3% | -38.9% | 9.8% | -56.5% | -25.8% | -71.8% | 5.4% | -59.8% |
| Change in Five Years | 101.5% | -50.0% | 17.6% | -45.0% | 49.0% | -76.7% | 3.5% | -68.6% | 35.6% | -67.0% |
| Change in Ten Years | - | - | 57.1% | -42.1% | 89.7% | -65.5% | 17.9% | -73.2% | 79.6% | -62.9% |
Source: Land Registry
August 16, 2018
![]()