Market unaffected by Brexit vote and sees further rises
|
The Ealing property market has continued to see prices rising to all-time highs even after the result of the EU Referendum.
Figures published by the Land Registry for the third quarter of this year show that the average price paid for a home in the W5 post code area was £835,801.
This represents a surge of 27.9% over the same period last year. However, this number should be treated with some caution as the main reason for the apparent rapid rise is a change in the proportion of types of properties being sold. With the turnover of houses holding up much better than flats the rise in the average overstate the rise in prices on a like for like basis.
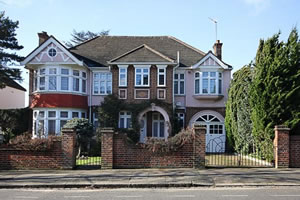
There remains interest in larger family properties. The top priced home sold during the period was a house on Park View Road which changed hands for £2,850,000.
Donald Collins, Sales Director, of Go View London who the house commented,
“It was a beautiful home, and Park View Road is one of the most sought after roads in the area given its wide, tree lined presence and proximity to Ealing Broadway.
“In the context of overall population in the Borough - Very few properties actually sell above £2.5million in Ealing and therefore it is vitally important to get the pricing right. We have a large database of buyers looking to purchase a family home for the next 20-30 years of their life so getting your marketing right is essential to deliver a successful transaction.
“If you are thinking of selling you need to allow around 6 months for the marketing to ensure good breadth of coverage and to enable parties to get into position to purchase, as typically there will 2-3 sales involved to make the top of the chain move.”
Looking at individual asset types both flats and terraced houses in W5 are changing hands at close to record levels but they haven't risen to the extent that the headline figure would suggest.
The picture is slightly different in West Ealing (W13) where prices have been broadly static with the average now at £662,001. Once again a shift in the ratio of flats to houses being sold has driven up this figure but the effect has been more muted in this area because of the relatively small number of larger homes being sold.
Across Ealing volumes are down to about half of what they have typically been in recent years. The decline has been biggest in flat and maisonette sales which have fallen by over 60%. There has been no recovery from the previous quarter when turnover in property was depressed by Stamp Duty changes and uncertainty about the EU Referendum vote.

The Land Registry’s House Price Index is showing that the average price of a home sold in London in August was £488,908 which is up 12.1% over the same month last year. For the UK as a whole the index shows and average price of £218,964 up by 8.4% compared to the previous year.
The short term indications for the market appear to be positive. Mortgage approvals for house purchases rose to a three-month high in September according to the Bank of England.
Simon Rubinsohn, RICS Chief Economist, said, “The dire shortage of available housing across the UK is continuing to push prices upwards, regardless of the uncertainty linked to the ongoing discussions surrounding Brexit. We are only weeks away from the Autumn Statement, and it will be interesting to see what measures – if any - the Chancellor will put in place to increase housing supply and create a more affordable market.”
The latest RICS monthly report states that agreed sales declined further in London with 16% more chartered surveyors seeing activity fall rather than rise in October. Projections for price growth over the next three months in Central London are broadly flat with 2% more respondents foreseeing a fall over the next three months rather than a rise. In the London lettings market, a fall was noted in tenant demand where, for the second consecutive quarter, 15% more surveyors reported a fall rather than a rise in enquiries. Sluggish demand in the capital is taking a toll on rent expectations and 12% more respondents are predicting a fall in rental values in the capital over the coming three months.
In a forthcoming edition of the EalingToday.co.uk newsletter there will be a complete listing of recent property sales in the area. To register to receive it click here.
| Ealing W5 Post Code Area Property Prices - (July-September 2016) | ||||||||||
|---|---|---|---|---|---|---|---|---|---|---|
Area |
Detached |
Sales |
Semi-detached |
Sales |
Terraced |
Sales |
Flat/ |
Sales |
Overall Ave |
Overall Sales |
| W5 1 | 0 | 0 | 1002190 | 5 | 835321 | 7 | 476850 | 10 | 710305 | 22 |
| W5 2 | 2658333 | 3 | 1760000 | 2 | 979167 | 3 | 520393 | 14 | 987182 | 22 |
| W5 3 | 1965000 | 4 | 1128836 | 7 | 0 | 0 | 448667 | 9 | 989992 | 20 |
| W5 4 | 1185000 | 1 | 970000 | 3 | 732600 | 10 | 475945 | 10 | 674185 | 24 |
| W5 5 | 0 | 0 | 1476667 | 3 | 899207 | 3 | 521250 | 6 | 854593 | 12 |
| Total | 2127500 | 8 | 1188640 | 20 | 817755 | 23 | 489366 | 49 | 835801 | 100 |
| Change in Quarter | 66.5% | 14.3% | -0.3% | 81.8% | -0.5% | 4.5% | 2.8% | -2.0% | 17.6% | 11.1% |
| Change in year | 34.1% | 0.0% | 17.3% | -4.8% | 4.7% | -34.3% | -0.9% | -59.8% | 27.9% | -46.2% |
| Change in three years | 94.6% | -50.0% | 44.4% | -25.9% | 26.6% | -54.0% | 37.8% | -59.5% | 55.6% | -53.3% |
| Change in five years | 10.1% | 166.7% | 75.2% | -31.0% | 66.4% | -57.4% | 73.3% | -32.9% | 83.0% | -37.1% |
| Change in ten years | 152.6% | -63.6% | 110.6% | -64.3% | 91.6% | -73.3% | 79.6% | -74.1% | 113.3% | -71.7% |
| Ealing W13 Post Code Area Property Prices - (July-September 2016) | ||||||||
|---|---|---|---|---|---|---|---|---|
Area |
Semi-detached |
Sales |
Terraced |
Sales |
Flat/ |
Sales |
Overall Ave |
Overall Sales |
| W13 0 | 872730 | 3 | 708167 | 7 | 422292 | 6 | 631819 | 16 |
| W13 8 | 1610000 | 2 | 0 | 0 | 471385 | 5 | 796704 | 7 |
| W13 9 | 1067333 | 3 | 763167 | 12 | 373000 | 10 | 643600 | 25 |
| Total | 1130024 | 8 | 742904 | 19 | 410508 | 21 | 662001 | 48 |
| Change in Quarter | 41.1% | -11.1% | -1.2% | 11.8% | 1.1% | -32.3% | 15.8% | -15.8% |
| Change in Year | 19.4% | -63.6% | -4.8% | -58.7% | 1.9% | -66.7% | 1.7% | -64.2% |
| Change in Three Years | 44.4% | -61.9% | 29.7% | -62.7% | 39.3% | -69.1% | 33.7% | -67.1% |
| Change in Five Years | 79.6% | -63.6% | 58.9% | -53.7% | 61.3% | -32.3% | 35.6% | -51.5% |
| Change in Ten Years | 128.8% | -81.8% | 86.8% | -76.3% | 90.4% | -76.4% | 75.9% | -78.9% |
Source: Land Registry
November 10, 2016
![]()