Three sales near Ealing Broadway in all-time top ten most expensive
|
The top end of the Ealing property market has been the most active this year. Since the start of 2016 three of the top ten highest ever prices have been paid for houses in the W5 area, all above £3,000,000.
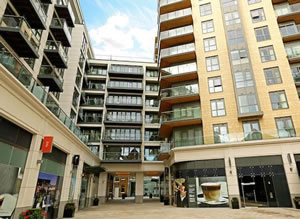
For flats too, it is the more expensive end of the market which appears to have seen most activity with sales in Arc Tower, Skyline House and Fitzroy House in Dickens Yard making up a significant proportion of sales in the area.
This has driven the average price in the W5 area to a new all-time high of £776,822 with the level rising by 14.4% in the first three months of 2016 compared with last year.
Most of activity has been in the W5 (2) post code sector which is the area closest to Ealing Broadway Station as buyers continue to seek places close to Crossrail stations. The three houses bought in the all-time top ten were on Park Hill, Park View Road and Hillcrest Road, all within walking distance of Ealing Broadway station.
The headline rise may be overstating the underlying strength of the market to a degree. The proportion of houses being sold compared to flats has risen in the latest numbers.
The West Ealing area reached record levels at the end of last year and appears to have paused for breath so far in 2016. However, prices in the W13 post code area are still up 7.6% to £657,556 compared to the same quarter in 2015.
There've been a total of 51 sales overall with flats and terraces proving to be the most popular.
Volumes appear low but this could be because not all the most recent transactions have yet been recorded.
Top Twenty Home Sales in Ealing W5 |
|||
|---|---|---|---|
Date |
Address |
Post Code |
Price (£) |
| 14/03/2014 | 5, Westbury Road | W5 2LE | 3,950,000 |
| 30/10/2013 | 17, Carlton Road | W5 2AW | 3,700,000 |
| 01/02/2016 | 25, Park Hill | W5 2JS | 3,700,000 |
| 26/06/2014 | 24, Mount Park Road | W5 2RS | 3,675,000 |
| 30/09/2014 | 13, Corfton Road | W5 2HP | 3,600,000 |
| 01/02/2016 | 1, Hillcrest Road | W5 2JL | 3,600,000 |
| 04/01/2016 | 50, Park View Road | W5 2JB | 3,500,000 |
| 03/08/2012 | 37, Blakesley Avenue | W5 2DN | 3,190,000 |
| 14/07/2014 | 23A, Park Hill | W5 2JS | 3,100,000 |
| 07/05/2013 | 39, Blakesley Avenue | W5 2DN | 3,000,000 |
| 28/07/2011 | 22, Woodville Gardens | W5 2LQ | 3,000,000 |
| 11/11/2015 | Flat 2 23, The Common | W5 3JB | 3,000,000 |
| 10/03/2016 | 40, Corfton Road | W5 2HT | 2,830,000 |
| 16/05/2014 | 12, Woodville Gardens | W5 2LG | 2,807,000 |
| 12/06/2014 | 34B, Woodville Road | W5 2SF | 2,750,000 |
| 09/12/2014 | 19, Mount Park Crescent | W5 2RN | 2,700,000 |
| 19/02/2014 | Flat 2 27, Corfton Road | W5 2HP | 2,670,000 |
| 18/04/2012 | 30, Woodville Gardens | W5 2LQ | 2,600,000 |
| 10/07/2014 | 1 Tunstall Court, Northcote Avenue | W5 3BS | 2,550,000 |
| 05/03/2015 | 32, Mount Park Crescent | W5 2RR | 2,515,000 |

The Land Registry’s March data for London shows a 13.9% rise over the last year to £534,785. This is higher than any other part of the country and makes London average twice the average for any other part of the country including the South East.
Annual growth of 6.7% in March brings the average house price in England and Wales to £189,901.
Over the last year prices in the London Borough of Ealing rose by 10.3% to £507,058.
The latest survey by the Royal Institution of Chartered Surveyors (RICS) has revealed that growth in the private and public housing sectors in London slowed down considerably. Private housing workloads rose at their slowest pace since Q4 2012, with only 20% more of those working in the sector reporting a rise in activity rather than a fall over the first quarter of 2016. During the last quarter of 2015 that figure was 44 per cent.
This easing in the private housing sector has not been offset by any increase in the construction of public housing, with growth in this sector remaining broadly unchanged from the previous quarter, and just 11% more surveyors reporting a rise rather than a fall in activity.
RICS Chief Economist, Simon Rubinsohn said, “On the surface, it might seem surprising that we are witnessing a slowdown in the construction sector just a few months after hearing the Chancellor’s ‘We Are The Builders’ speech, given the Government’s significant commitment to this sector. One might well ask why growth in private housing workloads is softening at a time when policy is firmly focussed on the creation of new starter homes. We have long held the view that starter homes cannot be the only solution. There is an issue around the availability of land on which new houses can be built, and we would like to see more being done to free up private brownfield sites.
“Our survey tells us that planning delays are one of the biggest barriers to growth in the construction sector. We have recommended that councils work together to create a team of emergency planners who can parachute into boroughs that are experiencing significant delays, therefore reducing a major growth barrier.
“That said, we cannot discount the climate of uncertainty caused by the forthcoming EU referendum. We know that a range of sectors have been affected by these issues as investors look to delay
In a forthcoming edition of the EalingToday.co.uk newsletter there will be a complete listing of recent property sales in the area. To register to receive it click here.
| Ealing W5 Post Code Area Property Prices - (January - March 2016) | ||||||||||
|---|---|---|---|---|---|---|---|---|---|---|
Area |
Detached |
Sales |
Semi-detached |
Sales |
Terraced |
Sales |
Flat/ |
Sales |
Overall Ave |
Overall Sales |
W5 1 |
0 |
0 |
790667 |
3 |
886458 |
9 |
450000 |
15 |
633338 |
27 |
W5 2 |
2926000 |
5 |
0 |
0 |
1415000 |
1 |
549094 |
30 |
903273 |
36 |
W5 3 |
1499167 |
3 |
1240000 |
3 |
484000 |
1 |
473437 |
8 |
832600 |
15 |
W5 4 |
0 |
0 |
877750 |
2 |
793028 |
16 |
412117 |
6 |
704860 |
24 |
W5 5 |
1850000 |
1 |
1180000 |
1 |
655000 |
1 |
491237 |
4 |
807136 |
7 |
Total |
2330833 |
9 |
1003056 |
9 |
829306 |
28 |
499174 |
63 |
776822 |
109 |
|
80.2% |
125.0% |
-6.9% |
-47.1% |
2.1% |
-24.3% |
5.8% |
-59.1% |
30.5% |
-48.6% |
|
77.4% |
-25.0% |
-8.7% |
-18.2% |
6.5% |
-12.5% |
-6.0% |
-39.4% |
14.4% |
-31.4% |
Change in three years |
59.7% |
-10.0% |
28.7% |
-10.0% |
35.7% |
-22.2% |
40.1% |
-40.0% |
52.9% |
-32.3% |
Change in five years |
- |
- |
44.7% |
12.5% |
71.7% |
16.7% |
58.2% |
-19.2% |
104.6% |
-0.9% |
Change in ten years |
113.7% |
-30.8% |
107.7% |
-77.5% |
114.9% |
-54.8% |
100.3% |
-54.7% |
114.3% |
-57.1% |
| Ealing W13 Post Code Area Property Prices - (January - March 2016) | ||||||||||
|---|---|---|---|---|---|---|---|---|---|---|
Area |
Detached |
Sales |
Semi-detached |
Sales |
Terraced |
Sales |
Flat/ |
Sales |
Overall Ave |
Overall Sales |
W13 0 |
1085000 |
1 |
841667 |
3 |
692500 |
2 |
413325 |
6 |
622912 |
12 |
W13 8 |
0 |
0 |
1185417 |
6 |
685650 |
3 |
367389 |
9 |
693108 |
18 |
W13 9 |
0 |
0 |
938750 |
2 |
721604 |
14 |
320900 |
5 |
646879 |
21 |
Total |
1085000 |
1 |
1046818 |
11 |
712863 |
19 |
369547 |
20 |
657556 |
51 |
|
-43.5% |
-50.0% |
-2.3% |
-8.3% |
-2.8% |
-55.8% |
-15.1% |
-47.4% |
-3.6% |
-46.3% |
Change in Year |
-44.7% |
-75.0% |
35.9% |
57.1% |
4.0% |
-9.5% |
-9.7% |
-48.7% |
7.1% |
-28.2% |
Change in Three Years |
- |
- |
38.8% |
-35.3% |
45.3% |
5.6% |
33.8% |
-31.0% |
41.9% |
-20.3% |
Change in Five Years |
- |
- |
39.3% |
83.3% |
56.2% |
-34.5% |
53.3% |
-55.6% |
84.0% |
-36.3% |
Change in Ten Years |
24.7% |
-75.0% |
140.3% |
-68.6% |
109.9% |
-64.8% |
69.4% |
-62.3% |
97.4% |
-65.1% |
Data in this report is subject to crown copyright protection.
May 12, 2016
![]()