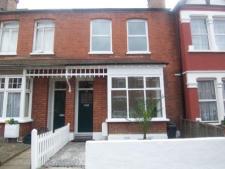
West Ealing plays catch up as more records are broken
|
Local estate agents are pointing to increased investment in Ealing as the driver of rising property prices in the area after the latest figures showed that new record highs have been reached.
There was a new all-time high for prices in the W5 post code area during the third quarter of this year with the average price reaching £530,652 according to the Land Registry. Prices are up 16.2% over last 12 months in W5.
West Ealing also saw strong rises with the average price reaching £461,192 in W13.
West Ealing saw sales rise by 43% over the previous quarter with 123 properties changing hands in the three month period to the end of September. Prices were also up strongly over last quarter but not an all-time high - that was achieved in the same period last year.
Over 5 years W5 and W13 property prices are up 18.7% and 17.6% respectively.
Paul Connolly, Managing Director of Orchards of London said, "Ealing overall has been heavily invested in which naturally has a ripple effect. Dickens Yard which houses luxury apartments and boutiques throughout not to mention Wagamama that is opening its doors to the public on 20 December whilst Pret A Manger took an exclusive corner in Ealing Broadway more than six months ago. Several other restaurants have also opened up in close proximity. Fabulous Boutique Hotel Xanadu also had their exclusive launch in November. I believe this is just the start of things to come!"
For England and Wales as a whole the House Price Index shows an annual price increase of 0.9% which takes the average property value in England and Wales to £161,777.
London was the region in England and Wales which experienced the greatest increase in its average property value over the last 12 months with a movement of 5.5 per cent.
The September data from Land Registry's flagship House Price Index shows an annual price increase nationally of 1.1 per cent which takes the average property value in England and Wales to £162,561.
The most up-to-date figures available show that during July 2012, the number of completed house sales in England and Wales decreased by 9 per cent to 56,509 compared with 62,303 in July 2011.
The number of properties sold in England and Wales for over £1 million in July 2012 increased by 13 per cent to 817 from 725 in July 2011.
In a forthcoming edition of the Ealingtoday.co.uk newsletter there will be a complete listing of recent property sales in the area.
To register to receive it click here.
| Ealing W5 Post Code Area Property Prices - July to September 2012 | ||||||||||
|---|---|---|---|---|---|---|---|---|---|---|
| Area | Detached | Sales | Semi-Det | Sales | Terraced | Sales | Flat/ Mais |
Sales | Total Ave | Total Sales |
| W5 1 | 0 | 0 | 849000 | 5 | 606142 | 13 | 242500 | 11 | 510081 | 29 |
| W5 2 | 1898166 | 6 | 0 | 0 | 580000 | 3 | 331003 | 22 | 658421 | 31 |
| W5 3 | 885375 | 4 | 711750 | 4 | 482500 | 3 | 324800 | 18 | 471807 | 29 |
| W5 4 | 0 | 0 | 430071 | 4 | 516341 | 22 | 283000 | 7 | 456387 | 33 |
| W5 5 | 0 | 0 | 868400 | 5 | 581875 | 8 | 344135 | 7 | 570297 | 20 |
| Total | 1493050 | 10 | 730794 | 18 | 552691 | 49 | 310552 | 65 | 530652 | 142 |
| Change in Quarter | -7.9% | 25.0% | 7.1% | 20.0% | 1.3% | 16.7% | 1.0% | 14.0% | 1.7% | 16.4% |
| Change in year | -22.7% | 233.3% | 7.7% | -37.9% | 12.5% | -9.3% | 10.0% | -11.0% | 16.2% | -10.7% |
| Change in three years | -3.9% | 66.7% | 25.9% | -41.9% | 21.3% | 28.9% | 23.0% | 12.1% | 19.1% | 6.8% |
| Change in five years | 16.5% | -33.3% | 16.3% | -48.6% | 10.7% | -10.9% | 7.2% | -52.9% | 18.7% | -41.6% |
| Ealing W13 Post Code Area Property Prices - July to September 2012 | ||||||||||
|---|---|---|---|---|---|---|---|---|---|---|
| Area | Detached | Sales | Semi-Det | Sales | Terraced | Sales | Flat/ Mais |
Sales | Total Ave | Total Sales |
| W13 0 | 0 | 0 | 551850 | 10 | 404933 | 9 | 252347 | 17 | 373689 | 36 |
| W13 8 | 1109000 | 4 | 904800 | 5 | 678333 | 3 | 272383 | 18 | 529930 | 30 |
| W13 9 | 0 | 0 | 722625 | 8 | 484852 | 37 | 304620 | 12 | 480280 | 57 |
| Total | 1109000 | 4 | 687978 | 23 | 482019 | 49 | 273367 | 47 | 461192 | 123 |
| Change in Quarter | - | - | 25.7% | 43.8% | -3.7% | 81.5% | -1.3% | 9.3% | 16.0% | 43.0% |
| Change in Year | -25.5% | -20.0% | 9.4% | 4.5% | 3.1% | 19.5% | 7.4% | 51.6% | -5.5% | 24.2% |
| Change in Three Years | - | - | 16.6% | 15.0% | 15.6% | 36.1% | 15.9% | 51.6% | 17.6% | 41.4% |
| Change in Five Years | -3.3% | 33.3% | 24.0% | -23.3% | 8.4% | -16.9% | -1.7% | -47.8% | 17.6% | -32.4% |
Data in this report is subject to crown copyright protection.
December 20, 2012
