Ealing's Coronavirus Death Toll Revealed
Figures show Southall and Greenford hardest hit by pandemic

|
Detailed data about the coronavirus outbreak has been published which shows that up until the middle of last month Southall and Greenford have had the highest number of deaths attributed to the disease in the borough of Ealing.
The Office of National Statistics (ONS) have published the number of fatalities at a very local level for the first time. The data is based on the analysis of registration of deaths including the residence of the deceased between 1 March and 17 April 2020 and where coronavirus was the underlying cause or was mentioned on the death certificate as a contributory factor.
The borough of Ealing is divided into Middle Layer Super Output areas by the ONS. Based on a very limit set of data, the area designated as Greenford West in the analysis seems to have been relatively badly hit with 21 deaths, the fourth highest total for an equivalent population area in the country. Greenford South also had an unusually high death rate with 13 fatalities.
The areas designated as Southall and Norwood Green also had a very high rates with 48 people in total dying from Covid-19 in this part of the borough. Norwood Green South had 14 fatalities.
Parts of West Ealing were also hard hit with the area designated as Cuckoo Park seeing 16 deaths.
It is thought possible that a higher number of care home in this area goes some way to explaining the apparently elevated death rate. Certain ethnic groups also seem more prone to the disease.
| Area | Total Deaths | Covid-19 Deaths | Covid-19 (%) |
|---|---|---|---|
| Whitton Avenue West (MSOA Ealing 001) | 12 | 4 | 33 |
| Horsenden (MSOA Ealing 002) | 8 | 2 | 25 |
| Northolt West (MSOA Ealing 003) | 17 | 8 | 47 |
| Northolt East (MSOA Ealing 004) | 10 | 7 | 70 |
| Bilton Road (MSOA Ealing 005) | 12 | 6 | 50 |
| Greenford North (MSOA Ealing 006) | 18 | 7 | 39 |
| Perivale (MSOA Ealing 007) | 7 | 2 | 29 |
| Northolt South (MSOA Ealing 008) | 12 | 7 | 58 |
| Kingshill Avenue (MSOA Ealing 009) | 8 | 1 | 13 |
| Greenford West (MSOA Ealing 010) | 39 | 21 | 54 |
| Hanger Hill East (MSOA Ealing 011) | 7 | 3 | 43 |
| Greenford South (MSOA Ealing 012) | 23 | 13 | 57 |
| Pitshanger (MSOA Ealing 013) | 15 | 9 | 60 |
| Greenford Ravenor Park (MSOA Ealing 014) | 10 | 3 | 30 |
| Cuckoo Park (MSOA Ealing 016) | 24 | 16 | 67 |
| Southall North (MSOA Ealing 017) | 17 | 9 | 53 |
| Drayton Green & Cleveland (MSOA Ealing 018) | 17 | 5 | 29 |
| Ealing Broadway West (MSOA Ealing 019) | 10 | 2 | 20 |
| Ealing Broadway East (MSOA Ealing 020) | 14 | 2 | 14 |
| Brent Valley (MSOA Ealing 022) | 9 | 3 | 33 |
| Southall Park (MSOA Ealing 023) | 14 | 8 | 57 |
| Southall West (MSOA Ealing 026) | 18 | 8 | 44 |
Ealing Common & Twyford Ave (MSOA Ealing 027) |
12 |
3 |
25 |
| West Ealing (MSOA Ealing 028) | 18 | 9 | 50 |
| Norwood Green North & Windmill Park (MSOA Ealing 029) |
20 | 9 | 45 |
| Hanwell (MSOA Ealing 030) | 11 | 3 | 27 |
| St Mary's (MSOA Ealing 031) | 21 | 6 | 29 |
| Northfields (MSOA Ealing 032) | 5 | 1 | 20 |
| Elthorne Park (MSOA Ealing 035) | 11 | 4 | 36 |
| Southall Green (MSOA Ealing 037) | 20 | 9 | 45 |
| Norwood Green South (MSOA Ealing 038) 14 confirmed deaths |
26 | 14 | 54 |
| South Ealing (MSOA Ealing 039) | 7 | 3 | 43 |
Source: ONS
The neighbouring area of Ravenscourt Park North was one of the worst hit in the country with 18 recorded Covid-19 deaths but it is thought possible this was also a result of the number of care homes in the area.
There were 538 deaths in the borough Ealing 239 of which were attributed to the virus. This gives a death rate of 103.2 making it one of the top ten worst hit local authority areas in the country. All of the top ten were London boroughs with Newham having the highest death rate of 144.3.
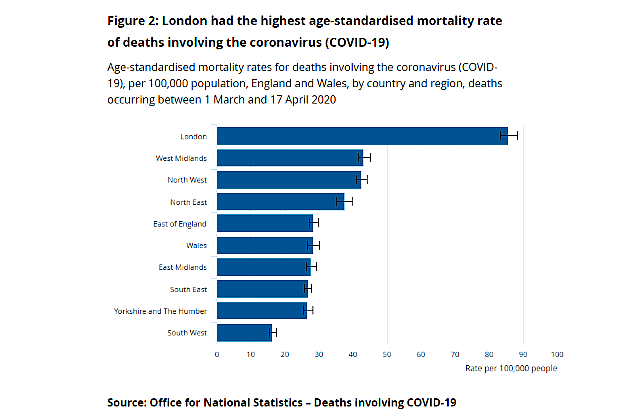
There were 90,232 deaths occurring in England and Wales that were registered by 18 April; 20,283 of these deaths involved the coronavirus. When adjusted for size and age structure of the population, there were 36.2 deaths involving Covid-19 per 100,000 people in England and Wales.
London had the highest age-standardised mortality rate with 85.7 deaths per 100,000 persons; this was statistically significantly higher than any other region and almost double the next highest rate.
The age-standardised mortality rate of deaths involving Covid-19 in the most deprived areas of England was 55.1 deaths per 100,000 population compared with 25.3 deaths per 100,000 population in the least deprived areas.

Nick Stripe, Head of Health Analysis, Office for National Statistics said, “People living in more deprived areas have experienced Covid-19 mortality rates more than double those living in less deprived areas. General mortality rates are normally higher in more deprived areas, but so far Covid-19 appears to be taking them higher still.”
Figures on deaths published by the ONS differ from those produced by the Department of Health and Social Care (DHSC) and the UK's public health agencies for two main reasons: the time between death and reporting of the death and the ONS's wider inclusion criteria.
May 14, 2020